How to read line-by-line and keep memory use low in Node.js
It’s easy to eat a lot of memory when parsing text in Node, especially when reading from a stream.
Suppose you’re reading data from the DARPA Intrusion Detection Data Sets, and you want to compute the mean time of an attack. Assume you’ve already processed the data so it’s just a list of timestamps as hours, minutes, and seconds.
10:09:57
02:13:20
00:03:36
10:21:33
19:37:32
Here’s JavaScript that parses each timestamp to get the total number of seconds and a count of the number of timestamps.
let total = 0;
let count = 0;

const parse = (timestamp) => {
  const [h, m, s] = timestamp.split(':');
  total += (Number(h) || 0) * 60 * 60;
  total += (Number(m) || 0) * 60;
  total += (Number(s) || 0);
  count += 1;
};
With that, you can compute the mean as Math.ceil(total / count). If you’re
reading timestamps from process.stdin in Node, you can store them in
a string and compute the mean once you’ve seen them all.
let text = '';

process.stdin.setEncoding('utf-8');

process.stdin.on('data', (data) => {
  if (data) {
    text += data;
  }
});

process.stdin.on('end', () => {
  const timestamps = text.split("\n");
  timestamps.forEach(parse);

  const mean = Math.ceil(total / count);
  console.log(`${mean} seconds`);
});
The gotcha is that all that text is kept in memory. Node has a maximum String
size, and it’ll throw exceptions if you try and read too much data. Running on
an old iMac, I can read about 512 MB before Node crashes.
To figure out how much memory this used, I ran the code above through Chrome DevTools on a 34 MB input file and captured two heap snapshots.
$ du -h data.txt
 34M    data.txt

$ node --inspect --debug-brk mean-time.js < data.txt
To start debugging, open the following URL in Chrome:
    chrome-devtools://devtools/remote/serve_file/...
Debugger attached.
Waiting for the debugger to disconnect...

The first snapshot is the amount of memory used on startup, before any data has been processed. It’s 3.2 MB. The second snapshot is the amount of memory used after all the data has been processed. It’s 38.3 MB.
Which means most of the memory is being used to store all that text. Fortunately, there’s an easy workaround. Check for complete timestamps as each new chunk of data comes in and parse each one on the fly.
let text = '';

process.stdin.setEncoding('utf-8');

process.stdin.on('data', (data) => {
  if (data) {
    text += data;

    const timestamps = text.split("\n");
    if (timestamps.length > 1) {
      text = timestamps.splice(-1, 1)[0];
      timestamps.forEach(parse);
    }
  }
});

process.stdin.on('end', () => {
  parse(text);

  const mean = Math.ceil(total / count);
  console.log(`${mean} seconds`);
});
This code splits the buffered text on newlines as it arrives. It parses
every timestamp but the last, which is used to start the next buffer. At the
end, it parses anything remaining. Saving that the last timestamp until the end
means that if we get a partial timestamp, like 02:13:, we won’t try to parse
it until we see the whole thing.
I ran the same experiment to see if memory use improved.
$ node --inspect --debug-brk mean-time.js < data.txt
To start debugging, open the following URL in Chrome:
    chrome-devtools://devtools/remote/serve_file/...
Debugger attached.
Waiting for the debugger to disconnect...
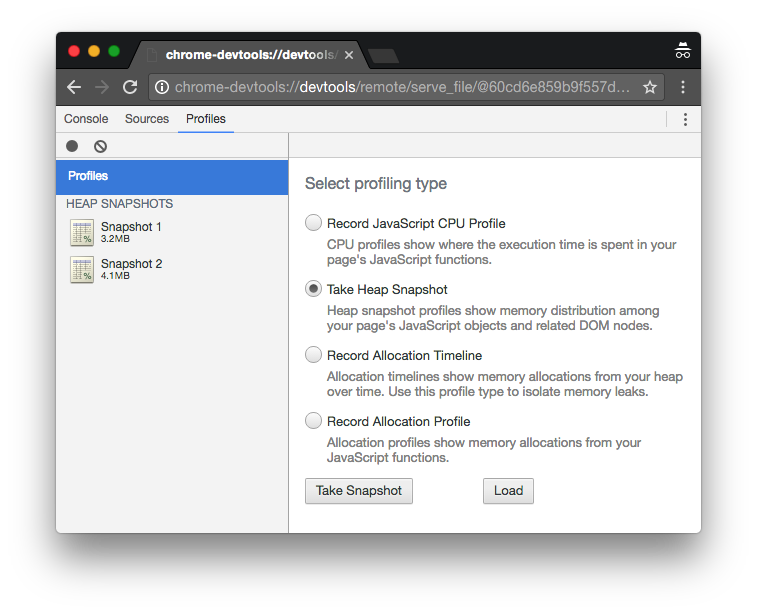
As before, the first snapshot is the amount of memory used on startup, before any data has been processed. It’s still 3.2 MB. The second snapshot is the amount of memory used after all the data has been processed. This time it’s only 4.1 MB. That’s 34.2 MB of memory saved!
By processing data as it becomes available, you can read data line-by-line and keep memory use low.